🪔
🎉 Festival Dhamaka Sale – Upto 80% Off on All Courses 🎊
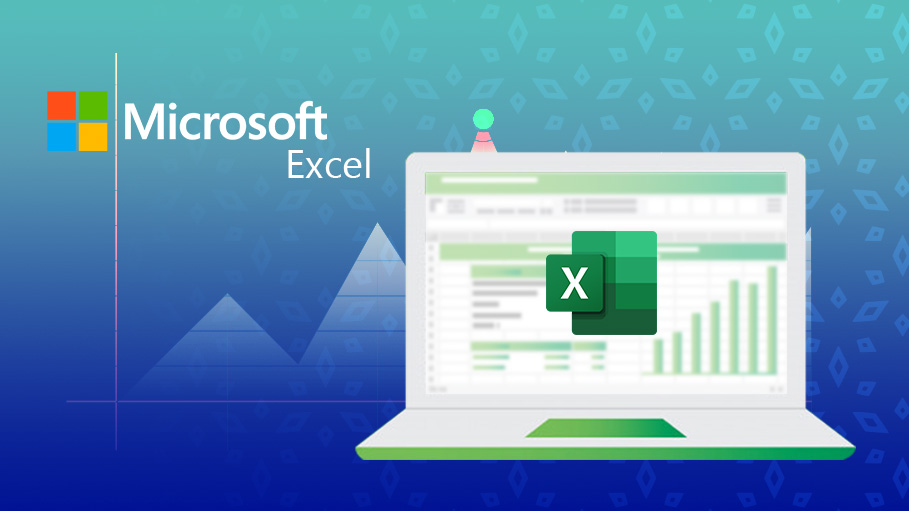
🎁INDIA'S NO. 1 INTERNSHIP PORTAL
🎉 Festival Dhamaka Sale – Upto 80% Off on All Courses 🎊
🎁INDIA'S NO. 1 INTERNSHIP PORTAL
Over 400 built-in functions for calculations, logic, text, and data manipulation.
Summarize and visualize large datasets with dynamic tables and interactive visuals.
Use VBA or Office Scripts to automate repetitive tasks and workflows.
Transform, merge, and clean data from multiple sources with no-code ETL tools.
Open Excel via Microsoft 365, desktop app, or web version.
Manually input data or connect to sources like CSV, SQL, SharePoint, or Power BI.
Use functions, conditional formatting, and named ranges to structure your sheet.
Insert charts, slicers, and pivot tables to explore trends and patterns.
Record macros, use Power Query, and share via OneDrive or Teams.
// Excel formula examples
=IF(A2>100000, "High", "Low") // Conditional logic
=VLOOKUP("Product A", A2:D100, 3, FALSE) // Lookup value
=SUMIFS(E2:E100, B2:B100, "North", C2:C100, "Q1") // Conditional sumBuild budgets, forecasts, and profit/loss models with formulas and charts.
Track stock levels, reorder points, and supplier performance.
Design forms, collect responses, and analyze results with filters and pivot tables.
Manage timelines, dependencies, and resource allocation with Gantt-style sheets.
Explore Microsoft Excel’s ecosystem and find the tools, platforms, and docs to accelerate your workflow.
Common questions about Microsoft Excel’s capabilities, usage, and ecosystem.